


Orbital Atherectomy of Severely Calcified LAD Lesion
Operator: Samin Sharma, MD
Interventional Fellow: Sunny Goel, MD
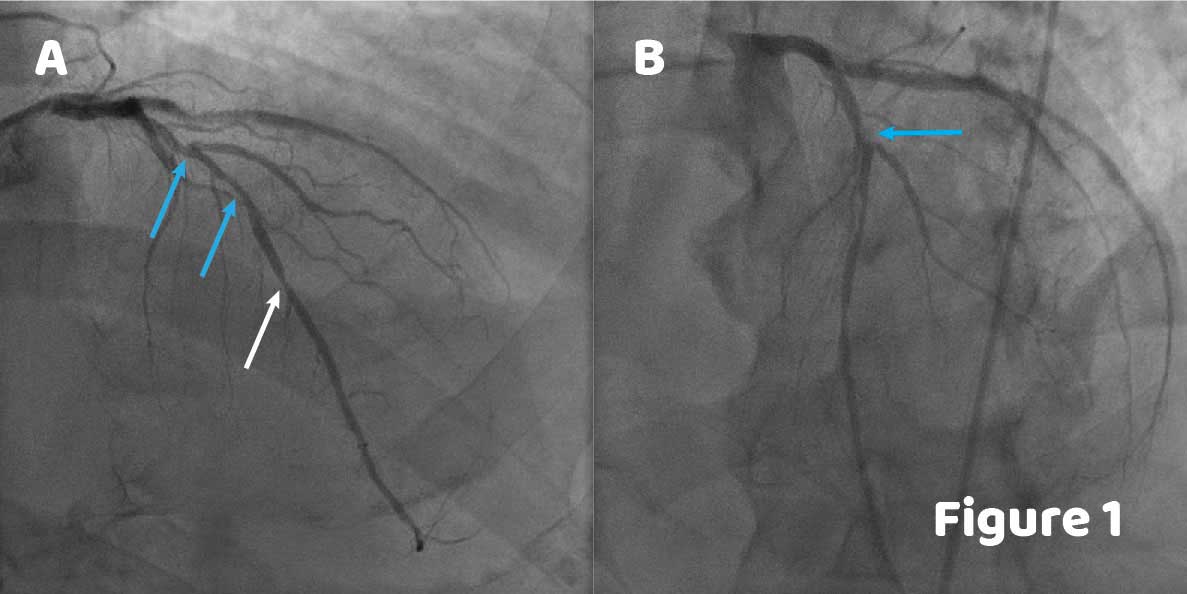
A 68-year-old man, past smoker, with diabetes mellitus, obesity, hyperlipidemia, hypertension and known 3-vessel disease status post multiple PCIs presented for staged PCI of LAD. Angiography showed multiple lesions including a bifurcation lesion and heavy calcification at the mid LAD (Figure 1A, blue arrows) with haziness at D2 (Figure 1B, blue arrow) as well as a lesion at the distal LAD (Figure 1A, white arrow).
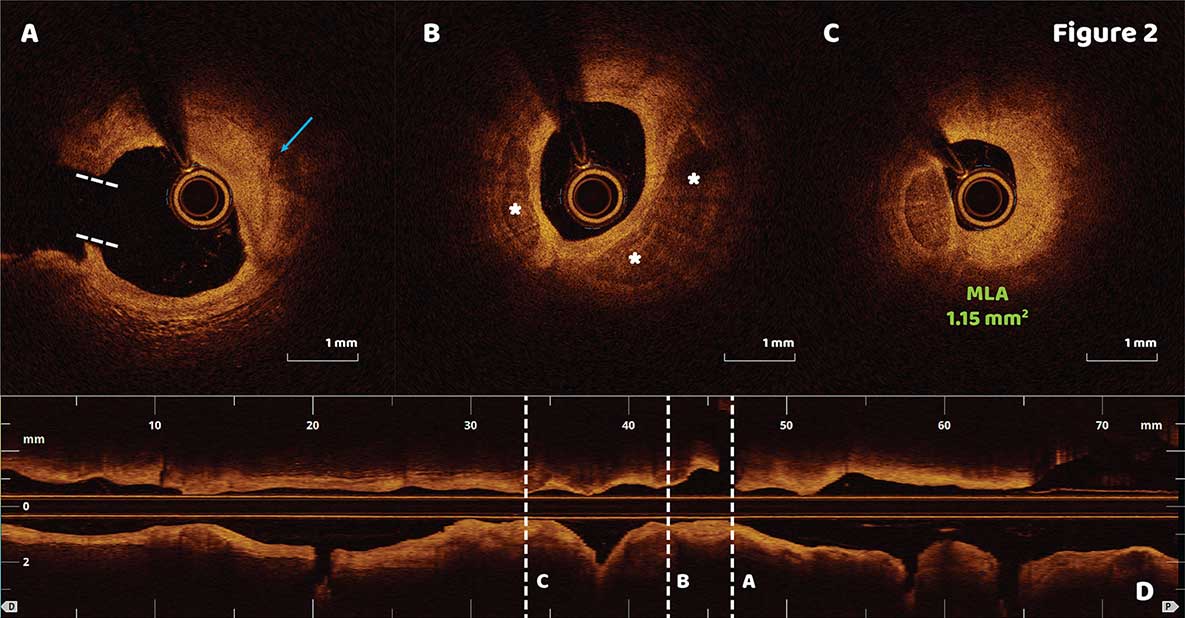
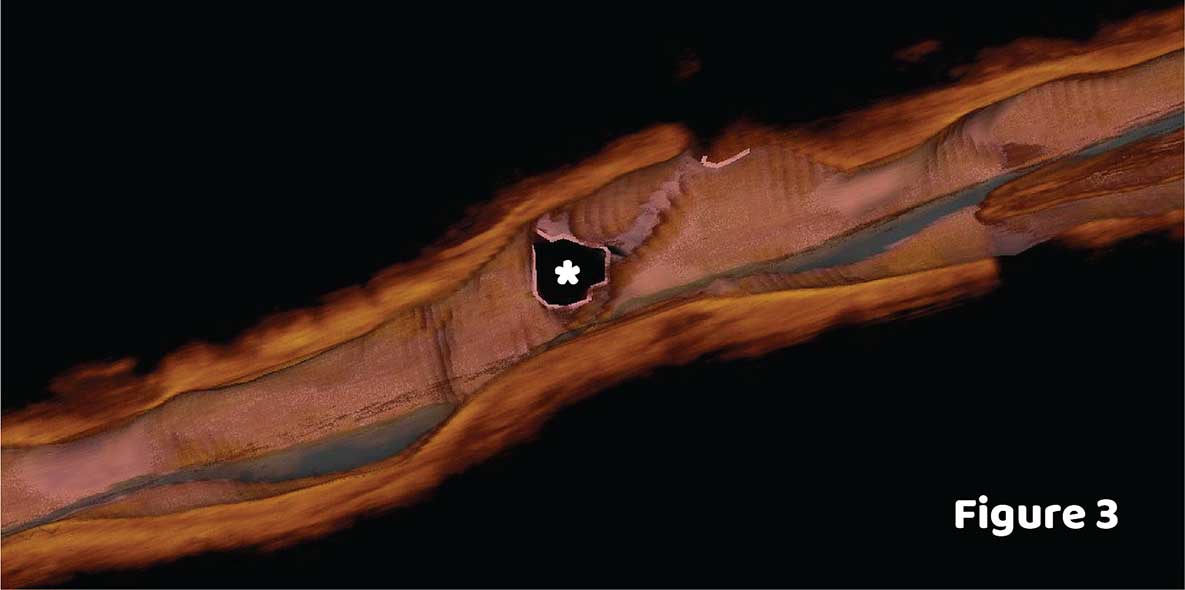
OCT imaging revealed a fibrocalcific plaque in the mid LAD and D2 bifurcation (Figure 2A, blue arrow; ostium of D2 represented by dotted white lines), three quadrants of calcium in the mid LAD (Figure 2B, asterisks). The minimal luminal area of 1.15 mm2 was measured 12 mm distal to the D2 bifurcation (Figure 2C). 3D OCT rendering showed the D2 ostium (Figure 3, asterisk).
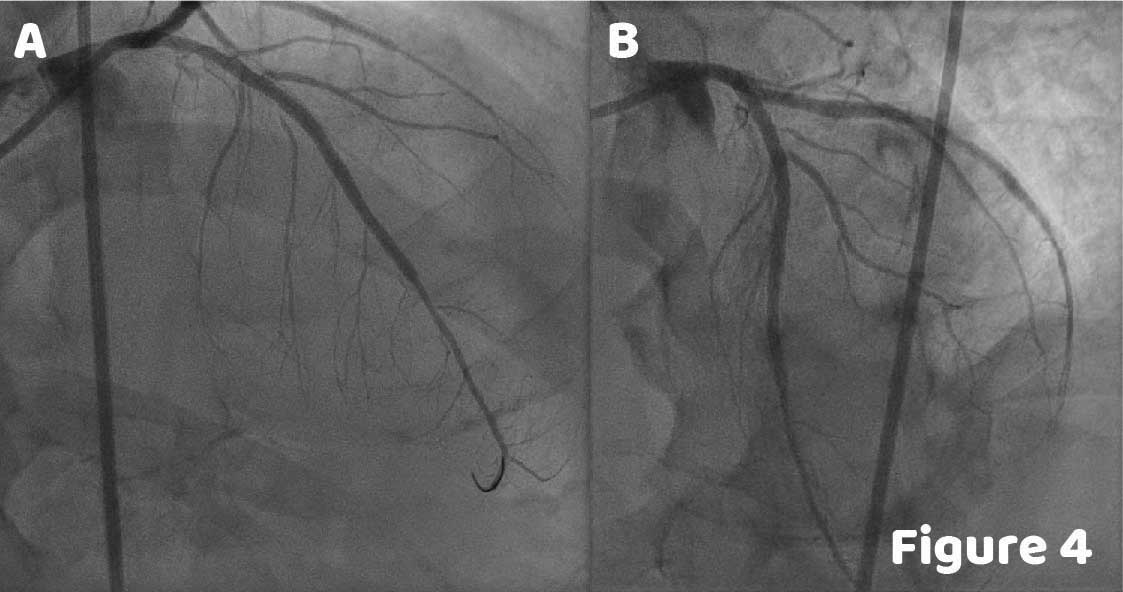
Orbital atherectomy was performed in both mid and distal LAD using a 1.25 mm burr at 80,000 rpm. After debulking, pre-dilation was performed with a 3 mm non-compliant balloon in both lesions followed by the deployment of two overlapping DES stents: 3.25×23 mm and 3×38 mm. Post-stenting angiography revealed satisfactory results (Figure 4).
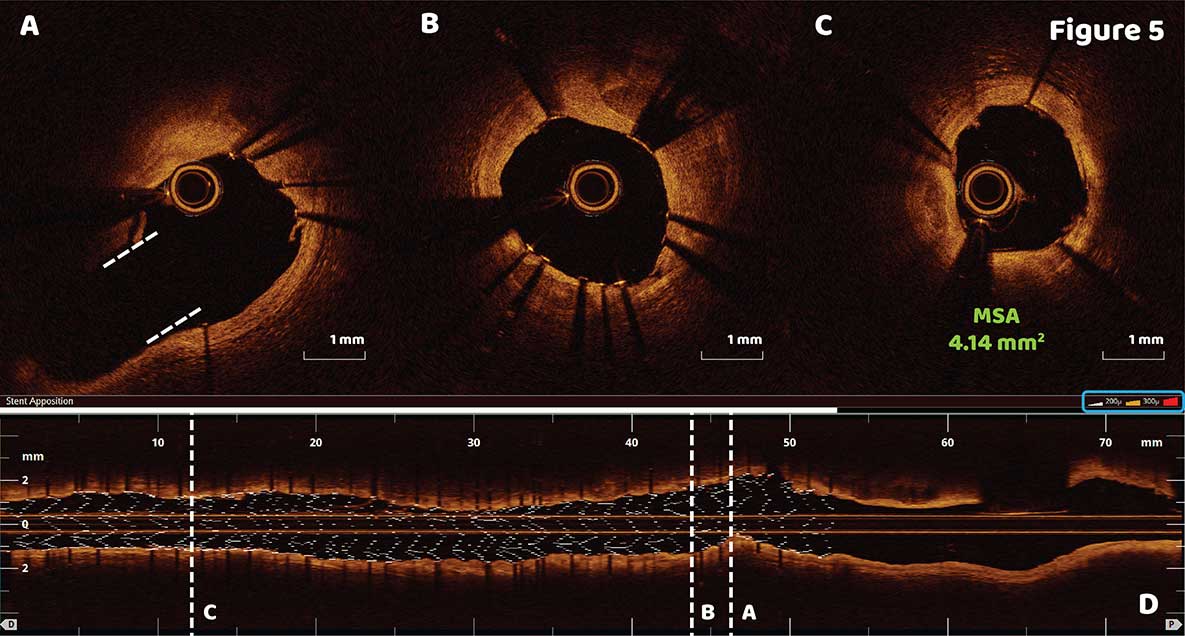
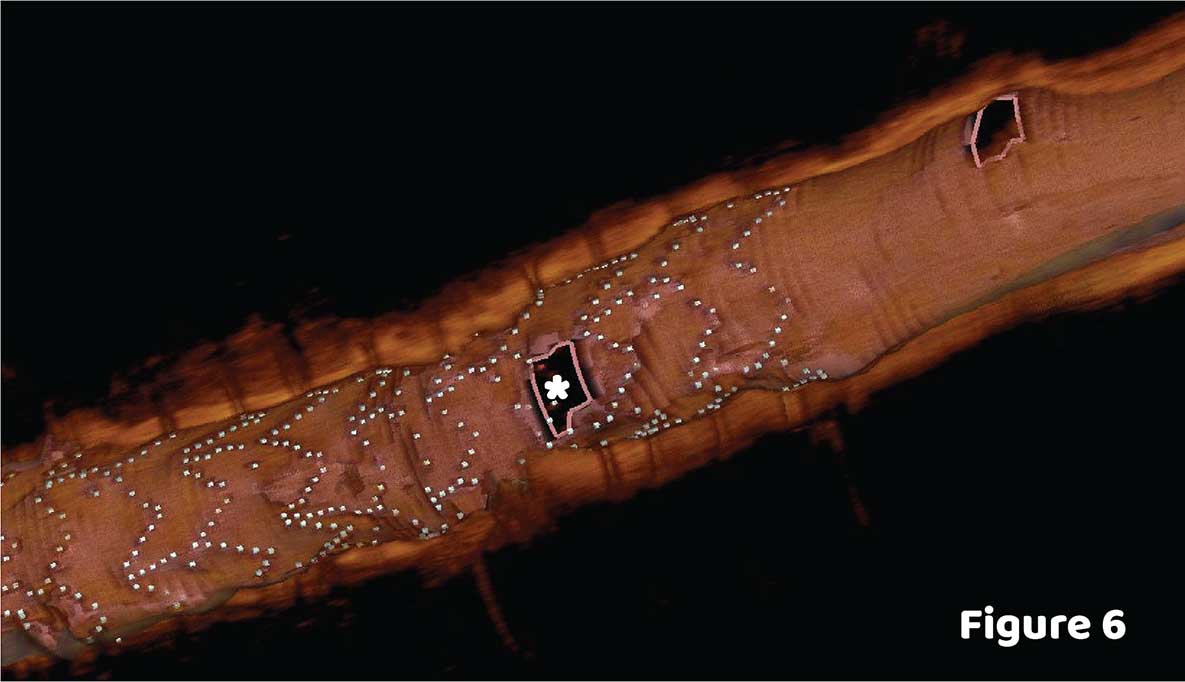
OCT showed good stent apposition and expansion with a minimal stent area 4.14 mm2 (Figure 5C). Longitudinal 3D stent reconstruction quickly confirmed good stent apposition. White, yellow, and red colors are assigned to each stent strut based on increasing degrees of malapposition (Figure 5D, Blue Box). An open D2 ostium is visualized in 3D OCT reconstruction (Figure 6, asterisk) which is also seen with the cross-sectional imaging (Figure 5A, dotted white lines). Good expansion was observed at the site of heavy calcification (Figure 5B) and the new MSA was determined to be 4.14 mm2 (Figure 5C).
Ask the Experts

Ask the Experts
We are ready to help you.
ask now
ask now
Take Quiz

Take Quiz
Know about OCT? Test your knowledge.
try it now
try it now
Meet the Team

Meet the Team
Read about the team behind the apps.
learn more
learn more
Contact Us

Contact Us
Reach out to us with general comments or questions.
connect now
connect now