


Normal arterial waveform generated by coronary catheter has following components:
- The systolic phase, characterized by a rapid increase in pressure to a peak, followed by a rapid decline.
- The dicrotic notch, which represents the closure of the aortic valve.
- The diastolic phase, which represents the run-off of blood into the peripheral circulation.
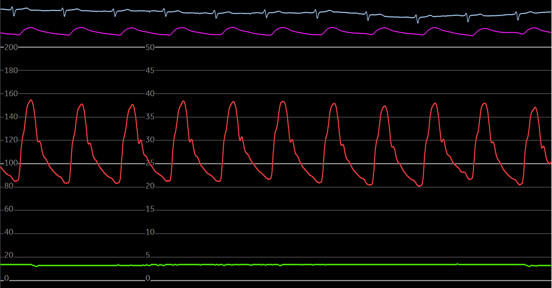
Figure 1: Pressure tracing from a 6F coronary catheter showing steep systolic upstroke wave, the dicrotic notch represents the nadir point that occurs immediately after the closure of the aortic valves and precedes the secondary dicrotic wave.
- Ventricularization
- Damping
Ventricularization:
Definition
This is a drop in the diastolic blood pressure that is more than the systolic. Wide pulse pressure, rapid diastolic decline, and small positive deflection immediately before systolic upstroke.
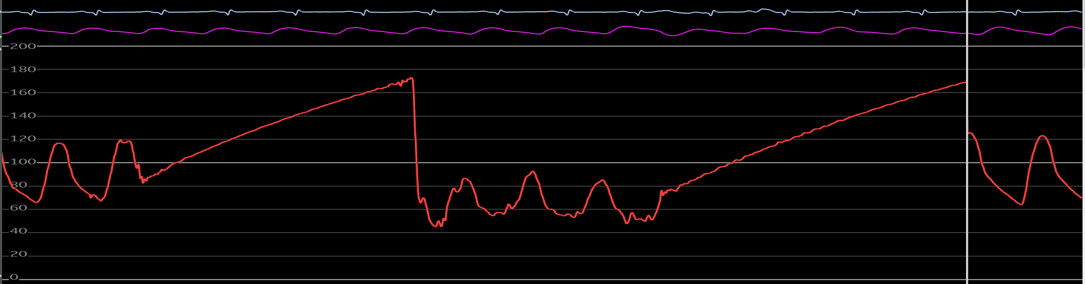
Figure 2: Coronary catheter tracing during coronary angiography of a patient with right coronary artery stenosis. Note the drop in the systolic blood pressure from 120 mm Hg to 80 mm Hg and diastolic BP from 70 mm Hg to 50 mm Hg.
Mechanism
The pressure wave form in ventricularization is derived from aortic pressure that is reduced across the narrowed ostium of the coronary artery. Due to reduced flow across the ostial stenosis, reduction in both systolic and diastolic pressure is noticed as well as there is a steep decline of the pressure in the diastole. The degree of pressure drops between ascending aorta and narrowed ostium is proportional to the degree of stenosis. A presystolic positive deflection is noticed on the ventricularized waveform that is thought to be contributed by atrial contraction.
Differentiating between Ventricularization and Ventricular Pressure:
The ventricularized coronary pressure waveform differs from the left ventricular pressure waveform by the following features.
- The left ventricular wave form has systolic pressure equal to the aortic systolic pressure and considerably lower end diastolic pressure, whereas ventricularization waveform has both reduced systolic and diastolic pressure as compared to the aortic pressures
- Ventricularization has slower upstroke than the aortic pressure and downstroke is steeper than aortic pressure
- There is a distinct presystolic deflection resembling wave in ventricularization
- The dicrotic notch is absent in ventricularization
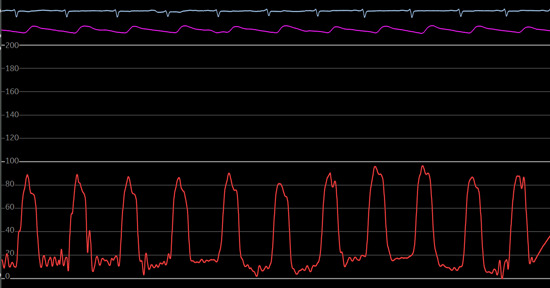
Figure 3: LV pressure waveform. Notice the rapid systolic upstroke, wide pulse pressure and the dicrotic notch.
Figure 4: Ventricularized waveform on engagement of RCA with ostial stenosis. Notice the slow systolic upstroke, a positive presystolic deflection.
Etiologies:
- Atherosclerotic disease of the ostium
- Catheter induced spasm
- Engagement of the small size artery with match in the ostium and catheter tip resulting in occlusion of the flow
- Deep seating of the catheter
- Kinking of the catheter during manipulation
- Air bubble or thrombus in the catheter
- Catheter tip abutting the wall of aorta
Damping:
Definition
A falsely low systolic and falsely high diastolic pressure.
Mechanism:
Complete obstruction of the flow at the distal end of the catheter results in flow limitation sufficient to decrease volumetric displacement of the fluid filled pressure system, resulting in a diminished wave propagation with a narrow pulse pressure and a slow upstroke and downstroke.
Etiologies:
- Mismatch between the outer diameter of the catheter and ostial diameter
- Catheter tip abutting the arterial wall

Figure 5: Coronary pressure tracing from RCA with ostial stenosis showing pressure wave damping. Notice the reduced systolic pressure, narrow pulse pressure, and a delayed upstroke and downstroke.
Managing Damping and Ventricularization
- If damping or ventricularization is noticed, catheter should be immediately withdrawn and should be repositioned
- If ostial stenosis is suspected the catheter should be withdrawn into the aortic root and non-selective aortic cusp contrast injection should be performed to assess presence of ostial stenosis
- A gentle injection of contrast while withdrawing the catheter the “hit-and-run” maneuver can also be performed
- Use of a guide catheter with side holes to reduce risk of ischemia from guide catheter occlusion of the ostium
Case example
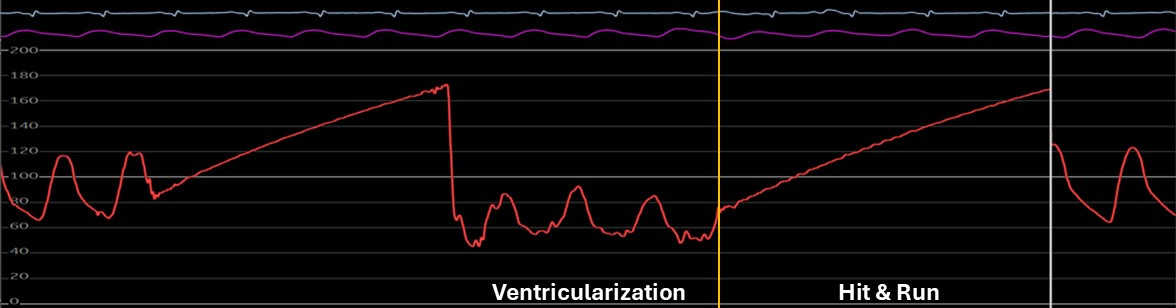
Figure 6: Coronary artery pressure waveform on engagement of the RCA with ostial stenosis. Notice the ventricularization of the waveform followed by contrast injection during a brief hit and run period and normal arterial waveform immediately after pullback.
Autoregulation of Coronary Blood Flow

Lesion Assessment Tools:
Translesional pressure assessment tools, to assess appropriateness of PCI, include resting or nonhyperemic pressure ratios (NHPR) and hyperemic pressure ratios (HPR). NHPR include iFR, Pd/Pa while HPR include FFR. These indices are specific for epicardial coronary disease.
What are the goals of intravascular lesion assessment tools?
- Avoid unnecessary revascularization
- Improve both periprocedural and long-term PCI outcomes in patients with CAD
- Diagnose microvascular dysfunction
Coronary microvasculature can increase coronary blood flow 3-5 times above the baseline in response to an increase in myocardial oxygen demand. This ability to augment blood flow from resting flow rates is termed coronary flow reserve.
CFR assesses both epicardial and microvascular compartments.
In the presence of mild to moderate coronary artery stenosis, myocardial perfusion is preserved by reducing resistance in the microvascular circulation and increasing the blood flow.
In severe coronary artery stenosis, the autoregulatory mechanism fails to maintain myocardial perfusion, resulting in ischemia at lower levels of increased oxygen demand or even at rest.

Fractional flow reserve (FFR) is the fraction of normal maximal flow that is preserved despite stenosis. It is represented as the ratio of the maximum myocardial flow in the presence of a stenosis to the theoretical maximum flow in the same vessel in the absence of a stenosis.1
FFR = mean hyperemic distal intracoronary pressure/mean hyperemic aortic pressure.
The normal value of FFR is 1.0, and an FFR of ≤ 0.80 is considered hemodynamically significant for ischemia.
The derivation of this FFR formula is based on Ohm’s law, which states that coronary flow is equal to coronary driving pressure divided by coronary resistance.

FFR measuring Technique:
It is recommended that the sensory guidewire should be advanced over a guiding catheter because of better support and the ability to offer prompt access with balloons or stents in case of coronary artery dissection or perforation. Anticoagulation is administered before the guidewire is advanced into the coronary artery. Isosorbide dinitrate or nitroglycerine is given intracoronary to minimize spasm and avoid measurement variability.
- The first step in FFR measurement is to calibrate and zero the guide catheter and pressure wire outside of the body
- Administer intracoronary nitroglycerin (100-200 mcg) and anticoagulation (Usually 70 U/Kg IV Heparin) for an activated coagulation time (ACT) > 250. Flush all the dye from the catheter
- Advance the tip of the pressure wire into the guiding catheter through the introducer needle and advance the radiopaque tip of the pressure wire 1 – 2 mm distal to the tip of the guide catheter to equalize pressure from the guiding catheter and the pressure wire
- Advance the guidewire across the stenosis at least 2 cm distal to the coronary artery segment being assessed, ideally all the way into the distal vessel
- Disengage the guide catheter
- Induce hyperemia by administering pharmacological agent, preferably adenosine
- The mean and phasic pressure signals are continuously recorded, and FFR is calculated at peak hyperemia as the ratio between the mean distal coronary artery pressure from the pressure wire to the mean aortic pressure from the guide catheter
FFR = Pd/Pa - After FFR is measured, the sensor wire can be removed from the interface, the pressure wire then can be used as an angioplasty guide wire
- At the end of the procedure, withdraw the pressure wire to the catheter tip and verify that the pressures remain equal and there was no transducer drift
2021 ACC/AHA/SCAI Guideline for PCI3


2018 ESC/EACTS Guidelines on Myocardial Revascularization

Important Considerations:
- Be careful to avoid guide catheter causing damping or ventricularization because this will falsely lower the Pa and FFR will be erroneously high
- Be careful to avoid using guide catheter with side holes, because administering intracoronary adenosine through the catheter with side holes will result in less dose delivered to the coronary artery and submaximal hyperemia will occur underestimating the FFR. Solution: use peripheral IV adenosine instead of IC adenosine.
- Transducer pressure drift can lead to erroneous FFR value. Withdraw the pressure wire to the tip of the catheter to confirm that pressure wire and catheter tip pressure are the same
- Be careful to avoid damage to the sensor while removing the pressure wire from the packaging coil or administering the wire into the catheter
Algorithm for FFR

Evan Shlofmitz, Allen Jeremias, FACC FFR in 2017: Current Status in PCI Management, JACC

Interventional Cardiology, Morton J. Kern
Special Cases:
- FFR LM disease: LM FFR alone cannot be accurately measured when there are significant downstream serial lesions. Presence of LAD/LCx disease makes the myocardial bed smaller for the LM leading to falsely higher FFR.
- FFR in SVG: Role of FFR in SVG lesions is controversial as the distal coronary pressure represents blood flow due to both SVG and a non-occluded native vessel
- FFR in acute myocardial infarction: FFR role in evaluation non culprit vessels in STEMI is controversial due to thrombus related microvascular obstruction and infarct related vasospasm
Adenosine (most commonly used agent in >95%):
Mechanism: cAMP mediated vasodilation
Administration: Both intracoronary and intravenous
Half-life: 1-2 min for IV and 30-60 sec IC
Dosage: Intra Coronary (IC) Right Coronary Artery (RCA): 50-100 mcg, IC Left Coronary Artery (LCA): 100-200 mcg,
IV infusion: 140 mcg/kg/min and high dose of 180 mcg/kg/min
Side effects: IC: Bradycardia, AV block, IV: Hypotension, Flushing, chest tightness, dyspnea
Reversal: Theophylline
Contraindications: Heart block, active bronchospasm, or reactive airway disease: COPD or asthma

Interventional Cardiology, Morton J. Kern
Instant Wave-free Ratio (iFR)
The iFR is a novel coronary hemodynamic assessment tool that utilizes the similar principles of FFR but does not require the use of a hyperemic agent. iFR has been proven to be non-inferior to FFR-guided PCI for major adverse cardiac events at 1 year follow up.5
iFR measures pressures during a specific period in the diastole known as the wave-free period. This phase occurs after the first 25% diastole and ends 5 ms before systole. During this phase of diastole, the intracoronary resistance at rest is stable and equivalent to the time averaged resistance during FFR measurements. The ratio of distal-to-proximal pressures during this wave-free period produces an index (iFR) that correlates closely with FFR.6

When a stenosis is significant enough to cause flow limitation, the ratio between Pd and Pa pressures measured during the wave free period falls below 0.9, suggesting that the stenosis is hemodynamically significant. The iFR value is averaged over 3-5 beats for normalization.
iFR Measuring Technique
Measuring iFR utilizes the same pressure wire used for measuring FFR. The steps for iFR measurements are the same except for the administration of a hyperemic agent and nitroglycerin.
- First step in iFR measurement is to calibrate and zero the guide catheter and pressure wire outside of the patient
- Advance the tip of the pressure wire into the guiding catheter through the introducer needle and advance the radiopaque tip of the pressure wire 1–2 mm distal to the tip of the guide catheter to equalize pressure from the guiding catheter and the pressure wire
- Advance the guidewire across the stenosis at least 2 cm distal to the coronary artery segment being assessed
- The mean and phasic pressure signals are continuously recorded, and iFR is calculated during the wave-free period of diastole as the ratio of the distal coronary artery pressure and aortic pressure. iFR is calculated over three beats.
- After iFR is measured, the sensor wire can be removed from the interface, the pressure wire then can be used as a routine wire and angioplasty can be performed
- At the end of the procedure, withdraw the pressure wire to the catheter tip and verify that the pressures remain equal and there was no transducer drift
Important Considerations
- Be careful to avoid guide catheter causing damping or ventricularization because this will falsely lower the Pa and iFR will be erroneously high

- Transducer pressure drift can lead to erroneous iFR value. Withdraw the pressure wire to the tip of the catheter to confirm that the pressure wire and the catheter tip pressure are the same
- Be careful to avoid damage to the sensor while removing the pressure wire from the packaging coil or advancing the wire into the catheter
Algorithm for iFR Assessment7

Resting Full Cycle Ratio (RFR)
RFR is a novel non-hyperemic index that is based on the largest drop in pressure throughout the cardiac cycle. RFR scans throughout the systole and diastole and the absolute lowest resting Pd/Pa value derived over five cardiac cycles is taken as the RFR value. An RFR value of ≤ 0.89 represents hemodynamically significant stenosis. RFR has shown to have similar diagnostic performance as compared to other non-hyperemic pressure indices.8
The RFR index studies indicate a threshold of ≤ 0.89 for consideration of revascularization.

Diastolic Hyperemia-free Ratio (DFR)
DFR is a resting diastolic index that uses the average Pd/Pa ratio within diastole over five consecutive cycles. The DFR index is based on two criteria:
- Identifying the portion of cardiac cycle below the average aortic pressure and selecting samples with negative slope
- It is equivalent in diagnostic and prognostic performance as the instantaneous wave-free ratio (iFR).9 The cut-off value for DFR is ≤ 0.89.
Index of Microcirculatory Resistance
The index of microcirculatory resistance (IMR) is an invasive, wire-based measure of the coronary microvascular function. The wire is equipped with a pressure sensor that also has the functionality of a thermistor, and flow can be calculated using a thermodilution technique. The flow across the coronary microvascular circulation is estimated by thermodilution technique to calculate the mean transit time of normal saline injected into the coronary artery at room temperature. A distinct advantage of IMR wire pressure system is the ability to simultaneously measure FFR to allow assessment of epicardial coronary arteries and IMR to allow assessment of the microvasculature coronary circulation.
The index of microcirculatory resistance is estimated by multiplying distal coronary artery pressure (Pd) with mean transient time (Tmn).
IMR = Pd X Tmn
An IMR value of ≥ 25 is suggestive of microvascular dysfunction.10
IMR measuring Technique
The following are the key steps for the practical measurement of IMR.
- The first step in the measurement of IMR is to calibrate and equalize the guide catheter and pressure wire outside of the patient
- In the RADI Analyzer console press on ‘Main Menu’, then ‘System’, then ‘Options’ and finally ‘CFR’. This will make the relevant thermodilution screen appear
- Advance the guidewire distal sensor at least 6 cm down the artery and 3 cm distal to a focal stenosis
- Induce maximal epicardial dilatation with 100–200 μg nitroglycerin to prevent flow-mediated vasodilatation during maximal hyperemia
- Under baseline conditions, inject 3 ml of room-temperature normal saline manually into the coronary artery. Repeat these injections twice more to obtain the mean baseline Tmn.
- Induce stable state maximal hyperemia. This has been achieved routinely by 140 μg/kg/min of adenosine administered through a central venous line, although intracoronary papaverine is a valid alternative. We recommend avoiding intracoronary adenosine because of the very short duration of action.
- Repeat the 3 ml normal saline injections thrice to obtain the average hyperemic Tmn
- The console will automatically calculate the CFR (as well as FFR)
IMR can then be determined easily by Tmn × Pdistal during maximal hyperemia.
2024 ESC Guidelines for measuring IMR14

Clinical Applications of IMR
- Coronary microvascular dysfunction in non-obstructive coronary artery (NOCA) and stable chest pain11
- Post PCI myocardial infarction12
- Elevated IMR post heart transplantation predicts mortality13
- Elevated IMR in STEMI predicts long term mortality, myocardial viability, and myocardial salvage
IMR in STEMI
Primary PCI routinely achieves epicardial antegrade flow in the culprit vessel; however, myocardial microcirculatory reperfusion is not achieved successfully in approximately one-third of all STEMI patients secondary to the microvascular obstruction, a finding associated with increased mortality.
J Am Coll Cardiol. 2009 Jul 21, 54(4):281-92
IMR assessment post-PCI in STEMI has the potential to identify patients with MVO.Hence IMR can predicts myocardial infarct size, myocardial viability, and long-term mortality in STEMI patients.
J Am Coll Cardiol. 2008 Feb 5, 51(5):560-5
IMR post-PCI in STEMI patients can help to stratify patients with MVO who will benefit from adjunctive therapies such as intracoronary vasodilators, glycoprotein IIb/IIIa inhibitors, novel therapies in clinical trials to patients with evidence of microvascular dysfunction for example intracoronary fibrinolytics, antiplatelet therapies, high dose statin.
CMD in Non-obstructive CAD
IMR in Post PCI
IMR is a strong predictor of post-PCI myocardial infarction. A pre-PCI IMR ≥27 U has a 80.0% sensitivity and 85.0% specificity for predicting periprocedural MI and is associated with a 23-fold risk of developing periprocedural MI.
Circ Cardiovasc Interv. 2012 Aug 1, 5(4):515-22
The pre-PCI IMR can identify patients with a subsequent risk of developing myocardial necrosis and may guide adjunctive prevention strategies. For example, direct stenting instead of balloon predilation and stenting, and intracoronary vasodilator administration in patients with elevated pre-PCI IMR have shown to reduce post PCI myocardial infarction.
IMR in Heart Transplantation
Coronary microcirculatory dysfunction plays an important role in post cardiac transplantation cardiac allograft vasculopathy. Cardiac allograft vasculopathy is a leading cause of late mortality after heart transplantation, affecting both the epicardial coronary arteries and the coronary microvasculature. For many years, the diagnosis of cardiac allograft vasculopathy has relied on assessing intimal thickening of the epicardial artery with intravascular ultrasound. More recently, invasive coronary physiology, and in particular IMR, IMR have been used to assess the microvasculature after cardiac transplantation. In cardiac transplant recipients, measures of coronary physiology, in particular microvascular dysfunction (IMR ≥20) identified at 1 year and abnormal epicardial artery function (FFR <0.90) at baseline, are independent predictors of late death or the need for transplantation.
There is a potential value in using IMR as a prognostic biomarker to stratify heart transplant patients at higher risk of transplant rejection and initiate targeted therapy for the prevention of allograft rejection.
