


Lesion Morphology
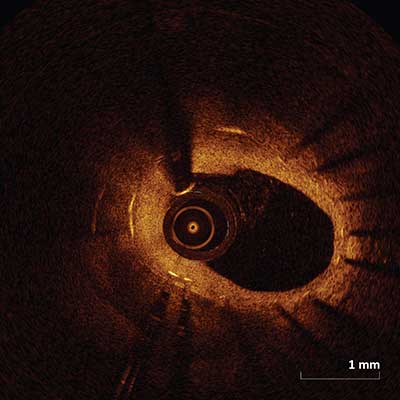
Normal Vessel
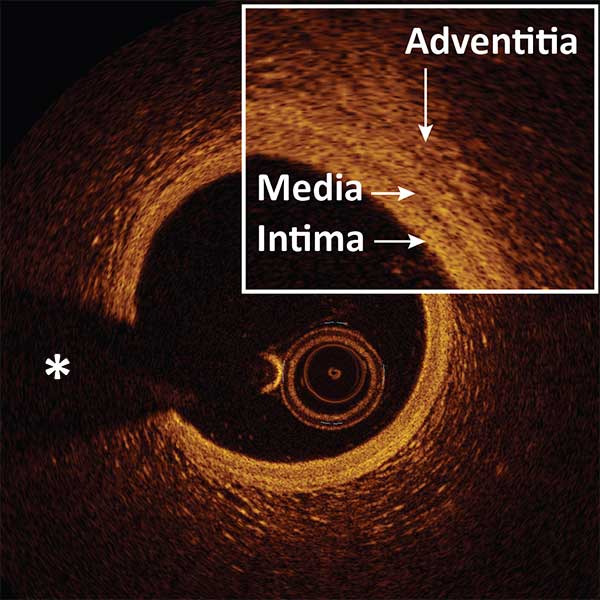 |
Three-layered structure: INTIMA, MEDIA, ADVENTITIA.
Signal-poor muscular MEDIA layer positioned between the thin high backscattering INTIMA layer and a heterogeneous high backscattering ADVENTITIA layer.
The dark band of media is surrounded by the internal elastic membrane and external elastic membrane, two thin layers of elastic fibers at the border between the intima and media, the media and adventitia.
*Guidewire artifact
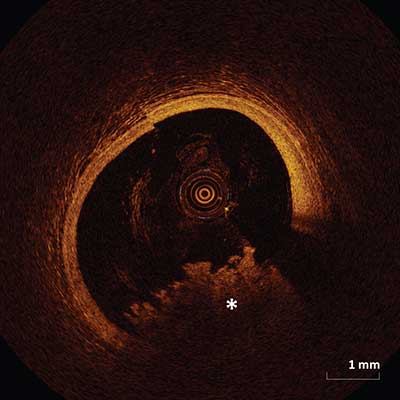
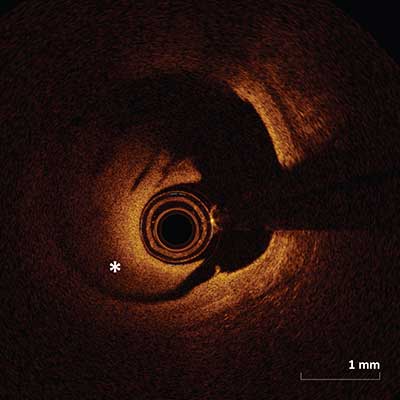
Fibrous Plaque
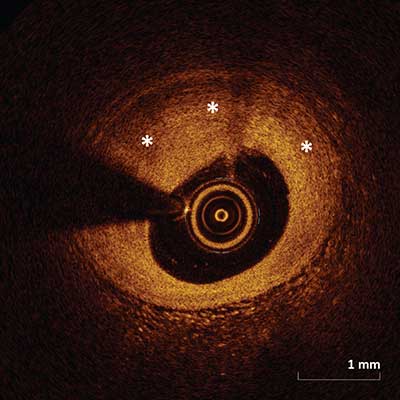 |
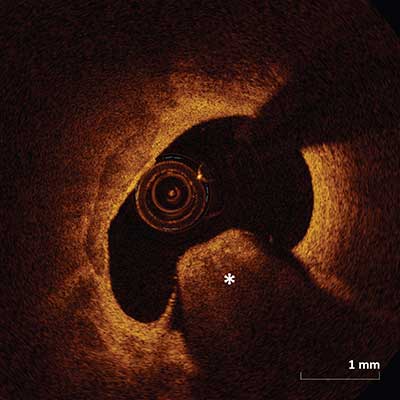
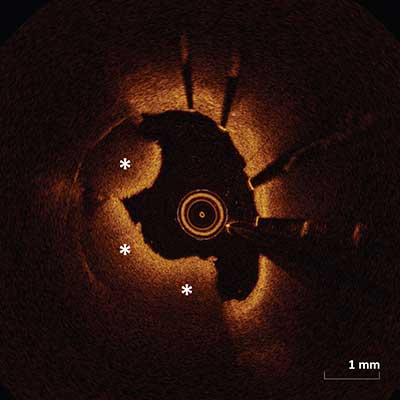
Fibrous plaque is represented by a high backscattering area with a relatively homogenous signal (asterisks).
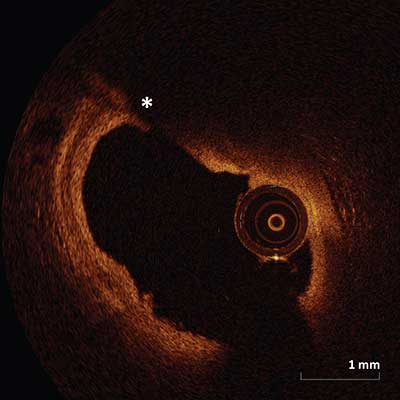
Fibrocalcific Plaque
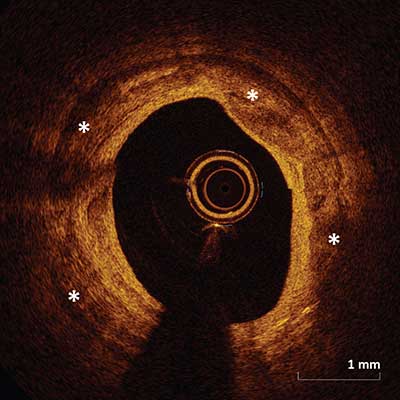 |
Contains fibrous tissue and calcification (asterisks) which appears as a signal-poor or heterogeneous region with a sharply well delineated border.
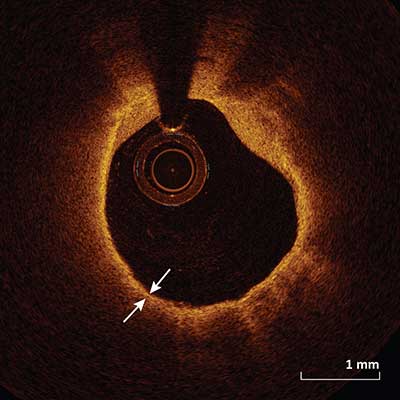
Fibroatheroma
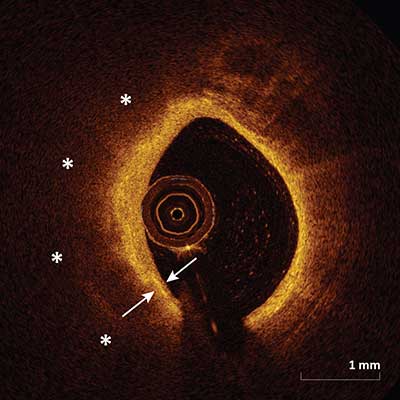 |
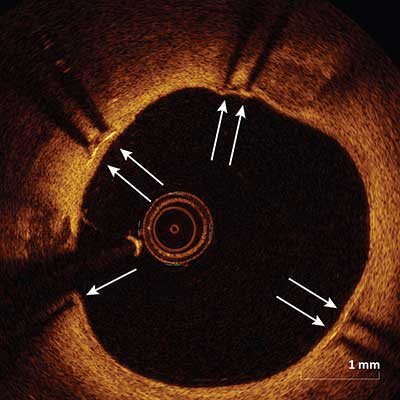
A fibroatheroma is a combination of a fibrous cap (arrows) and a necrotic core (asterisks). A fibrous cap is a signal-rich tissue layer overlaying a signal-poor region. The necrotic core is a signal-poor region within an atherosclerotic plaque with poorly delineated borders, a rapid signal drop-off and little or no signal backscattering within a lesion that is covered by a fibrous cap. It is imperative to note the distinction between signal-poor regions of calcium which have sharply delineated borders and signal-poor regions of necrotic core which have poorly defined borders.
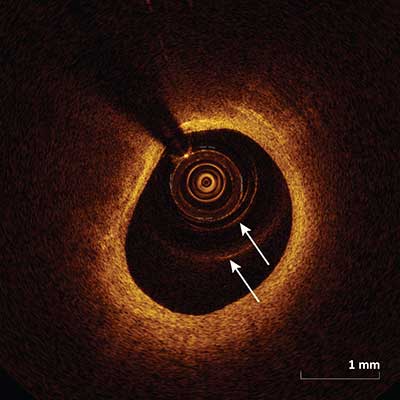
Thin Cap Fibroatheroma
 |
A thin cap fibroatheroma is defined as a delineated necrotic core with an overlying fibrous cap where the minimal cap thickness (arrows) is less than a predetermined threshold (usually <65 µm). Other data suggests a cap thickness threshold of <55 µm associated with plaque rupture and >85 µm associated with plaque stability.
Macrophages
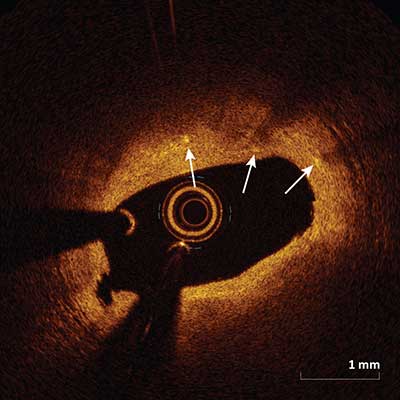 |
Macrophages appear as signal-rich, distinct or confluent punctate focal regions (arrows) that exceed the background intensity speckle noise. Macrophages attenuate the OCT light significantly and as a result superficial macrophages can shadow underlying tissue giving the appearance of a necrotic core.
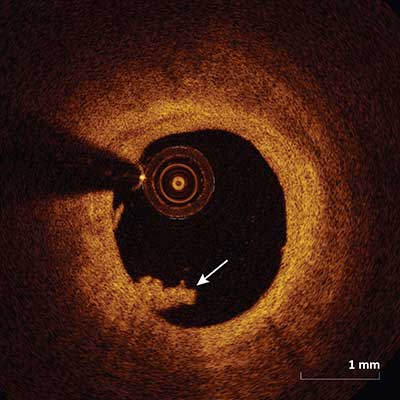
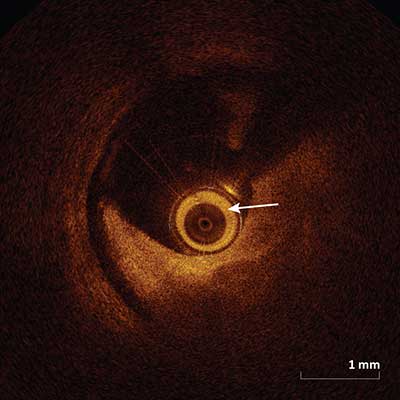
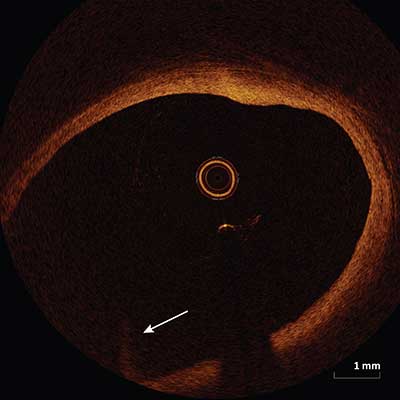
Intimal Vasculature
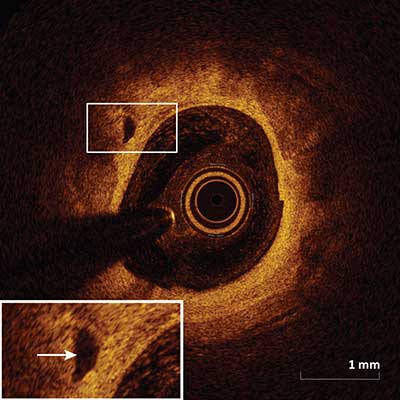 |
Appear as signal-poor voids seen within the intima that are sharply delineated and represent vessels (arrow) and can be visualized in multiple contiguous frames.
Cholesterol Crystals
 |
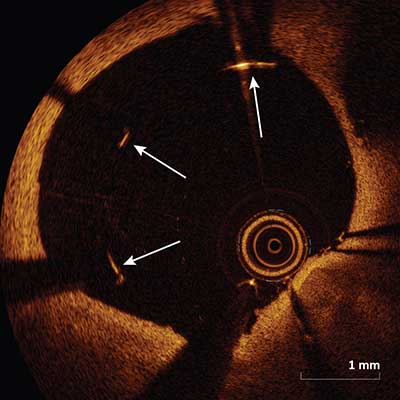
Cholesterol crystals (arrow) appear as high intensity thin linear regions usually associated with a fibrous cap or necrotic core.
Red Thrombus
 |
Red thrombus appears as a highly backscattering and highly attenuating mass (asterisk) attached to the luminal surface or floating within the lumen.
White Thrombus
 |
White thrombus appears as a homogenous mass (arrow) attached to the luminal surface or floating within the lumen with relatively less backscattering and very little signal attenuation.
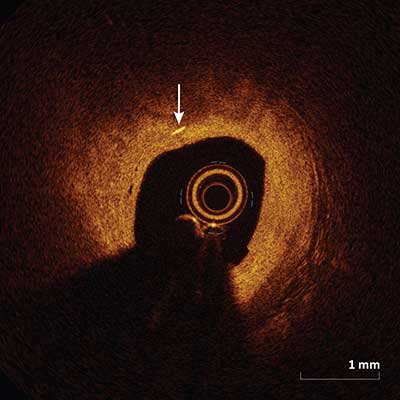
Unstable Lesions and Ruptured Plaque
Plaque Rupture
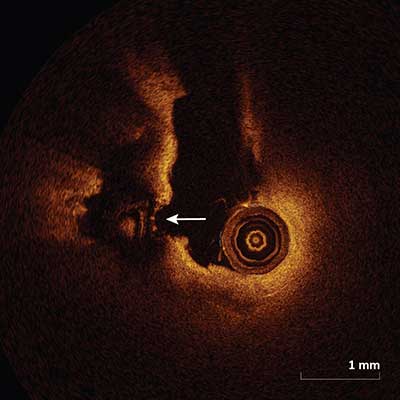 |
Plaque rupture frequently occurs in the setting of a thin cap fibroatheroma and appears as intimal tearing, disruption or dissection of the fibrous cap (arrow).
Plaque Erosion
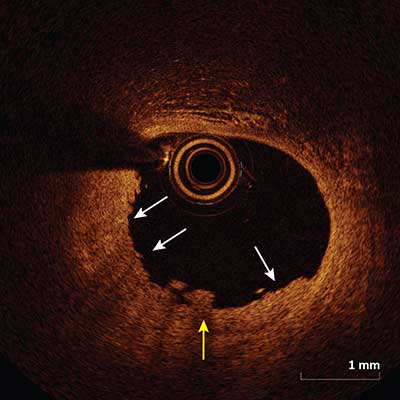 |
Plaque erosion appears as a presence of thrombus (yellow arrow) on an irregular luminal surface with no evidence of plaque rupture (white arrows) when evaluated in multiple adjacent frames.
Calcific Nodule
 |
Single or multiple regions of calcium (asterisk) protruding into the intracoronary lumen forming sharp angles.
Stent Assessment
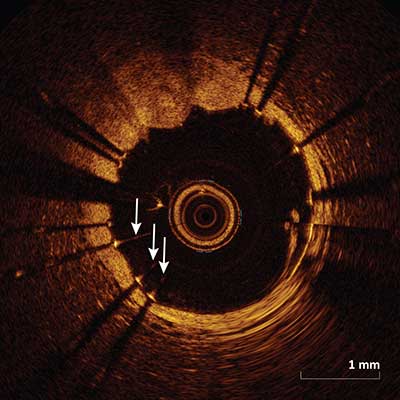
Malapposition
 |
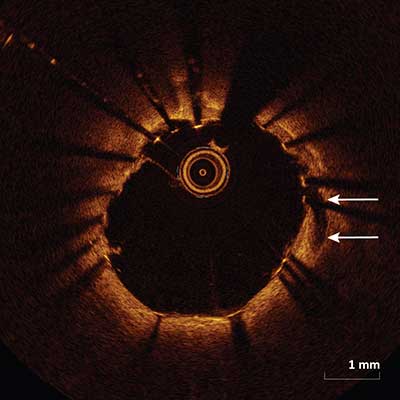
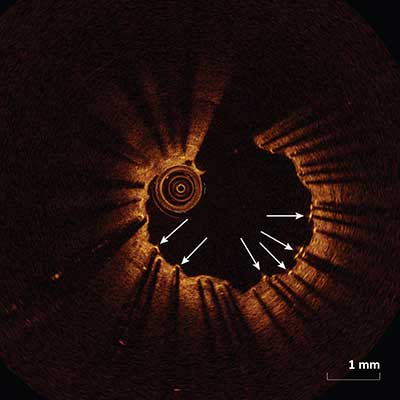
Malapposition (arrows) occurs when the axial distance between the stent strut’s surface to the luminal surface is greater than the strut thickness (including the polymer if present). If this distance is less than the strut thickness, then the strut is considered apposed. Two forms of apposition have been described: protruding, where the endoluminal strut boundary is located above the level of the luminal surface, and embedded, where the endoluminal strut boundary is below the level of the luminal surface.
In-Stent Dissection
 |
Disruption of the luminal vessel surface within the stented segment (arrows).
Stent Edge Dissection
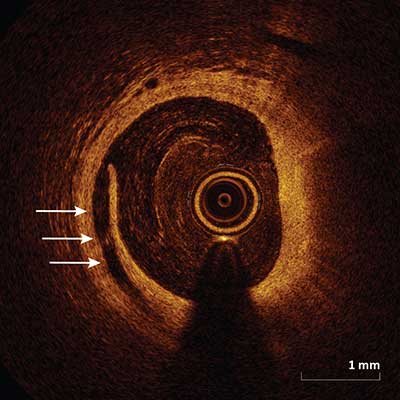 |
Appears as a disruption of the lumen surface (arrows) at the edge of the stent.
Tissue Prolapse
 |
Protrusion/projection of tissue into the lumen between the stent struts (arrow) after implantation.
In-Stent Thrombus
 |
Thrombus protruding into the lumen (asterisks) in-between or over the stent struts. Within the stent there may be red thrombus (as depicted above) which appears as a highly backscattering and highly attenuating mass or white thrombus which appears as relatively less backscattering with very little signal attenuation.
Covered Stent Struts
 |
Stent struts are termed covered if overlying tissue (arrows) can be seen above the strut.
Uncovered Stent Struts
 |
Stent struts with termed uncovered if there is no evidence of tissue (arrows) which can be seen above the strut.
In-Stent Restenosis
 |
May appear as signal-poor layered or signal-rich neointimal tissue (as depicted above) overlying the stent struts.
Artifacts
Guidewire Artifact
 |
Appears as a shadow (asterisk) from the guidewire which can mask the underlying image.
Shadowing Artifact
 |
Appear as a drop in the signal on the abluminal side of the vessel by opaque object. Shadows can completely occlude or may diminish the image intensity of deeper structures. Common objects that create shadows are opaque and include the guidewire and metallic stent struts. Blood in the catheter (arrow) can also cause shadowing.
Multiple Reflections
 |
Circular lines (arrows) are created within the image which appear as a result of light reflection from the catheter surface which can lead to erroneous measurements when these lines are inappropriately used for calibration instead of the catheter edge.
Saturation Artifact
 |
Reflection of a light source off a reflective surface such as the wire or stent strut cause a backscattered signal which is too high to be detected by the detector resulting in streaking scan lines of varying intensity (arrows) along the axial direction.
Sew-Up Artifact
 |
Misalignment of the intimal border (arrow) occurs as a result of movement of the vessel, wire or catheter during a single cross sectional acquisition.
Fold-Over Artifact
 |
Appears as a portion of the vessel folded over (arrow) and occurs when the vessel is larger than the ranging depth. Fold-over artifact is most commonly seen in large caliber vessels adjacent to the respective side branch.
Residual Blood Artifact
 |
Appears as intraluminal residual blood (asterisk) which results in scatter and an unfocused image and occurs as a result of sub-optimal vessel flushing. Blood within the lumen may be misinterpreted as a thrombus in some cases.
Tangential Signal Drop Out Artifact
 |
Signal-poor area (asterisk) within the artery as a result of catheter position near or touching the vessel wall. The catheter position causes the optical beam to be parallel to the tissue surface causing attenuation as it passes along the wall and as result there is an area of signal dropout.
OCT Guided Percutaneous Coronary Intervention
Pre-PCI Lesion Assessment
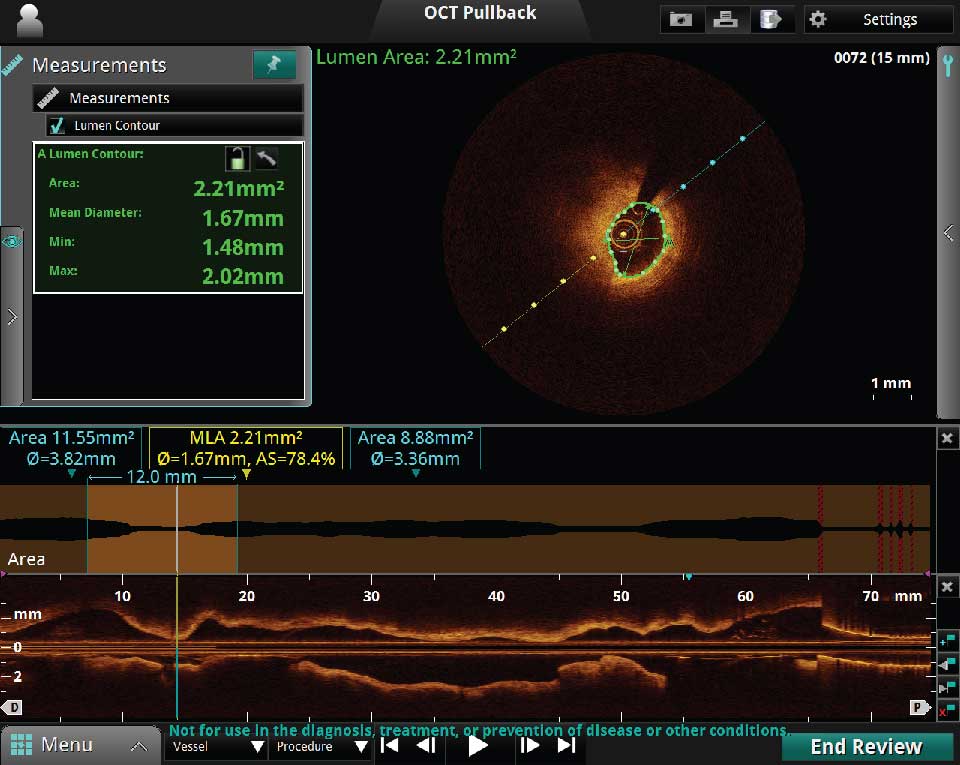
Prior to stent implantation OCT can provide quick and accurate measurements of the minimal luminal area (MLA), distal and proximal reference areas, diameters and lesion length. OCT can be used to determine landing zones to estimate the optimal stent length.
There are two types of pullback modes: the 75 mm Survey Mode and the 54 mm High Resolution Mode:
- The 75 mm Survey Mode – fast and efficient and utilizes minimal contrast.
- The 54 mm High Resolution Mode – has twice the frame density producing a relatively sharper image.
Stent Diameter Sizing
There are two measurement methods used to determine stent diameter sizing:
- External Elastic Lamina
- Luminal Measurement
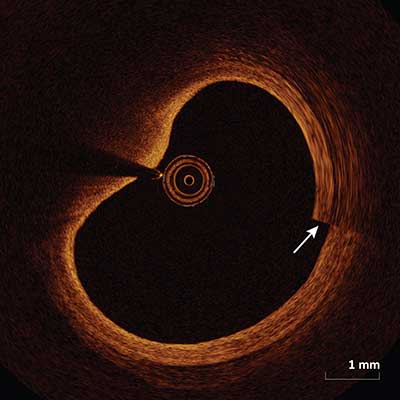
External Elastic Lamina
Benefits of using External Elastic Lamina to determine stent diameter:
- Luminal OCT guided measurement PCI may lead to stent under-sizing, when compared to intravascular ultrasound (IVUS) likely due to incomplete vessel wall visualization.
- Stent sizing based on pre-intervention OCT measurements of the external elastic lamina (EEL) overcomes the problem of stent undersizing.1
- EEL based stent size decision can be made only if the EEL can be visualized in more than 180 degrees at the reference sites.
- After making multiple measurements at the distal and proximal reference segments, the mean external elastic lamina is obtained for the two reference segments. Use of the smaller of these two diameters rounded to the nearest 0.25 mm is recommended to determine stent diameter.
- For post-stenting balloon dilatation use a non-compliant balloon diameter no larger than the reference vessel external elastic lamina.1
1Lancet 2016; 388: 2618–28.
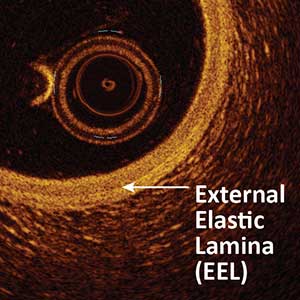
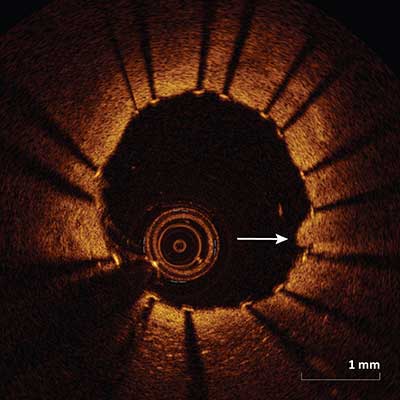
Figure I. External Elastic Lamina. The white arrow below indicates the external elastic lamina (EEL) which is situated directly between the media and adventitia layers.
Luminal Measurement
How to use Luminal measurement to determine stent diameter:
- Stent diameter is determined by measuring lumen diameter at the proximal and distal reference sites. In general, lumen diameter at the distal reference site is smaller than that at proximal reference site.
- Stent diameter is determined as 0–0.25 mm greater than mean lumen diameter at the distal reference site.1
- For post-stent dilatation, a non-compliant balloon diameter up to 0.5 mm larger than the post-PCI mean reference lumen diameter is recommended.2
1European Heart Journal, Volume 38, Issue 42, 7 November 2017, Pages 3139–3147.
2Lancet 2016; 388: 2618–28.
Stent Length Sizing
- The Cross Sectional OCT: The cross sectional images should be reviewed during the pullback in order to find a landing zone which is void of lipid or calcium rich plaque so that when the stent is deployed we can prevent stent edge dissections.
- The Landing Zones: The measurements made at the level of the potential landing zones proximally and distally to the lesion are key.
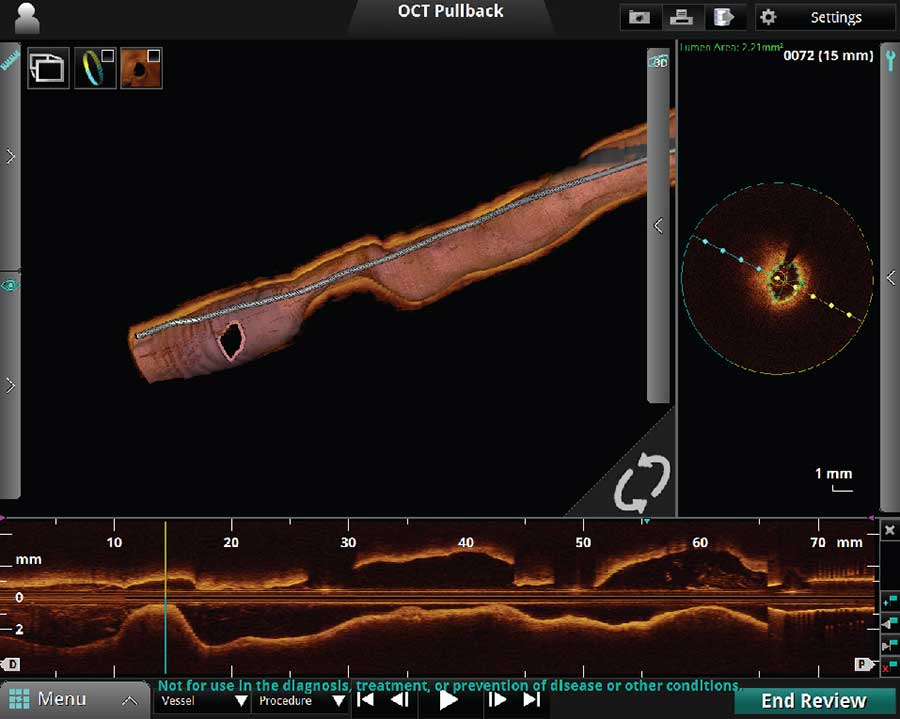
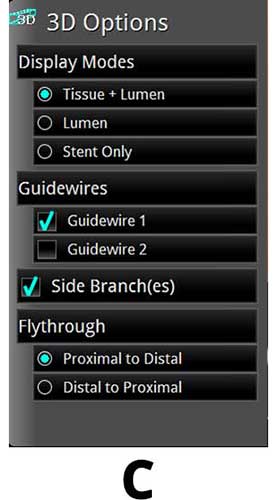
3D OCT
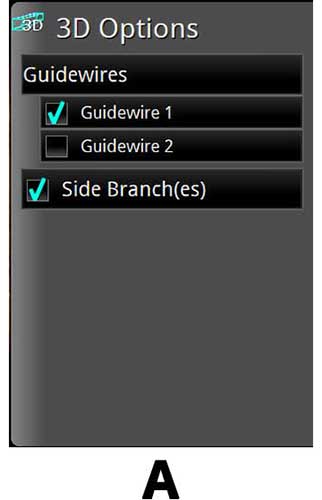
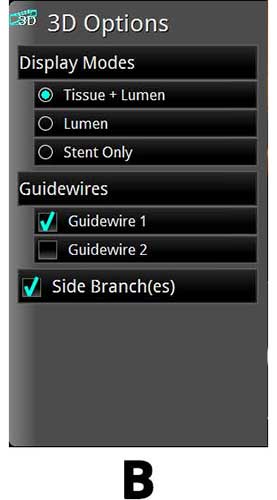
A. 3D Bifurcation
B. 3D Navigation with Rendered Stent on
C. 3D Navigation with Rendered Stent and Flythrough on
3D Rendering of OCT is a new software feature which can be performed real time. The 3D Navigation 3D Rendering is an excellent function to use to visualize vessel geometry and the ostium of the side branch as seen below. The Segmental Lumen function is a helpful tool to use if visualization within the lumen is desired.
3D Bifurcation Ostial View Display
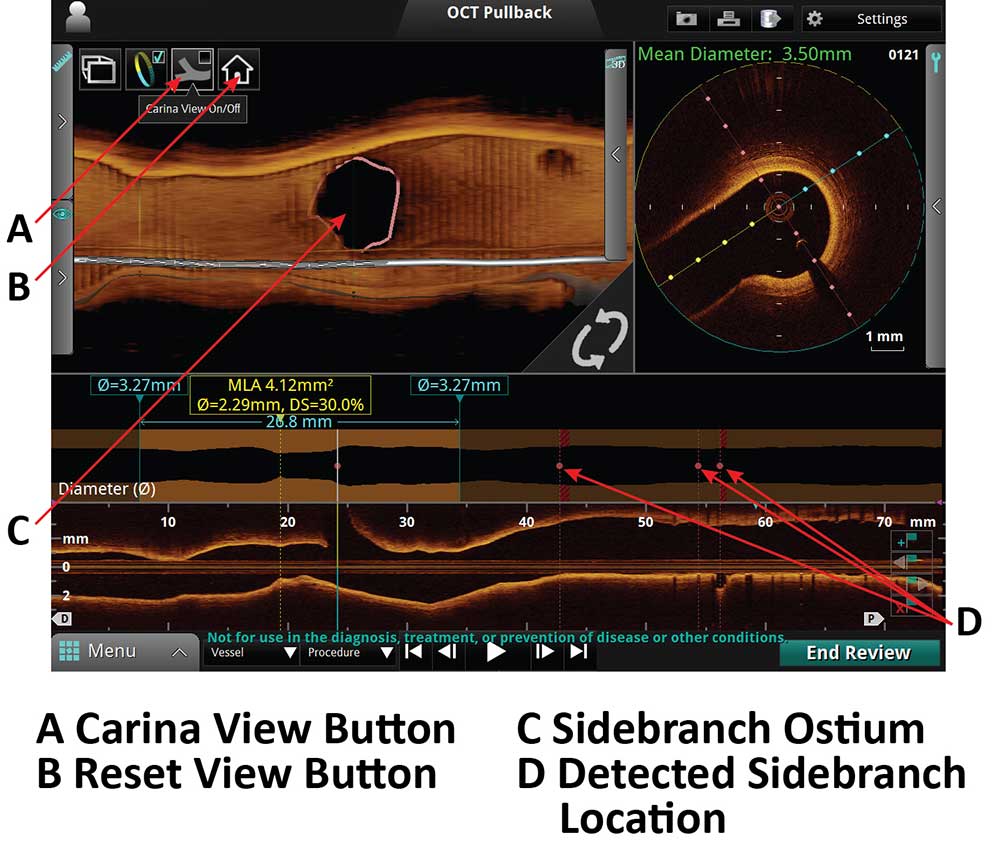
A. Carina View Button
B. Reset Button View
C. Sidebranch Ostium
D. Detected sidebranch location
3D Bifurcation Carina View Display
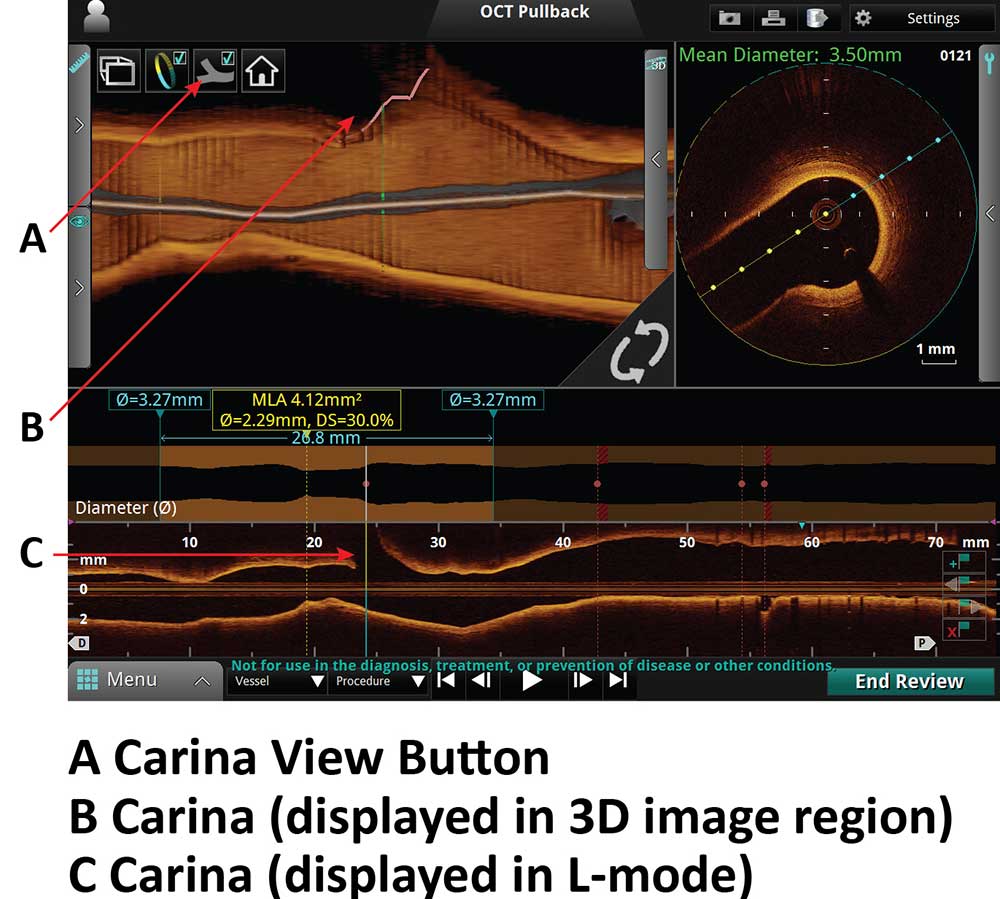
A. Carina View Button
B. Carina (displayed in 3D image region)
C. Carina (displayed in L-Mode)
Post PCI Assessment
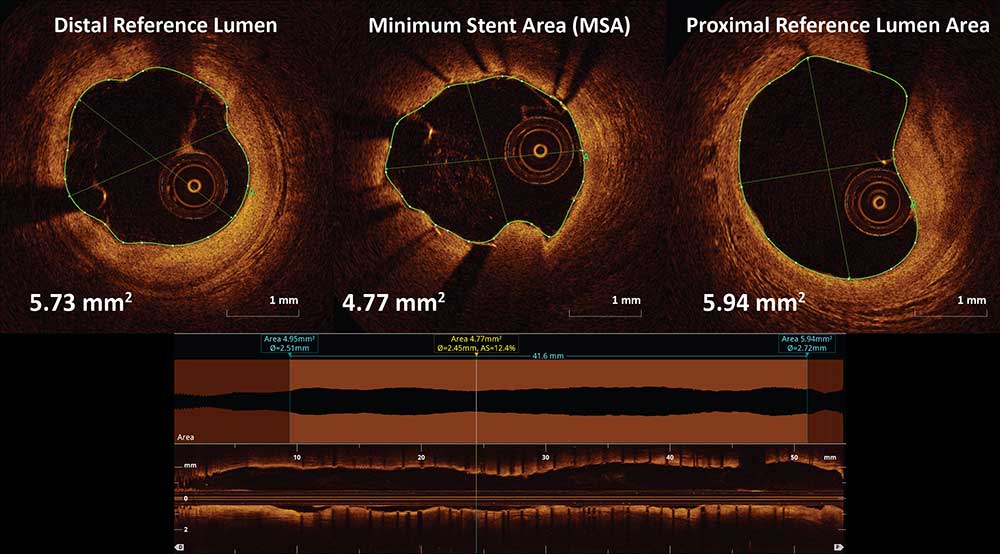
Stent Expansion = MSA/Average Reference Lumen Area * 100
Can be performed automatically using the lumen profile feature which provides minimal stent area (MSA) and reference lumen area. Stent percent expansion is calculated via these measurements using the formula above.
Post Stent Display Function
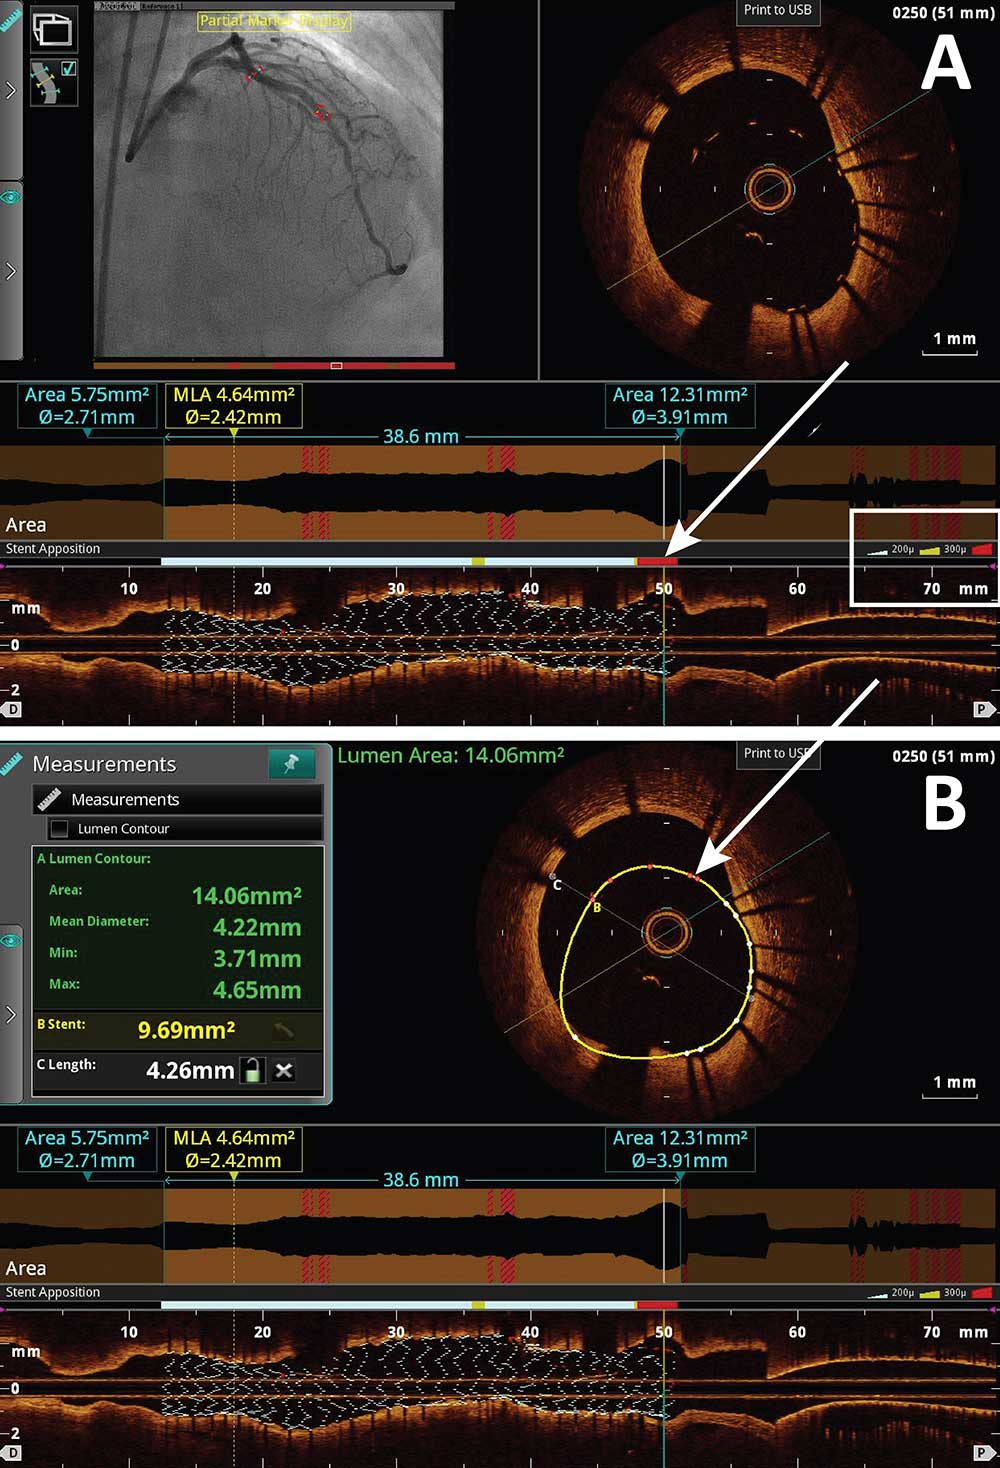
The stent display function is a recently developed tool which color codes malapposed stent struts based on the severity of the malapposed stent strut as seen in Figure A and Figure B. As indicated by the white box noted in Figure A, white, yellow and red colors are provided to each stent strut based on the degree of the malapposition. As depicted in the above in figures via the white arrows, these color coded regions appear on the angiogram and on the longitudinal and cross sectional OCT images. Simultaneous measurements can be made as well.
In The Lab
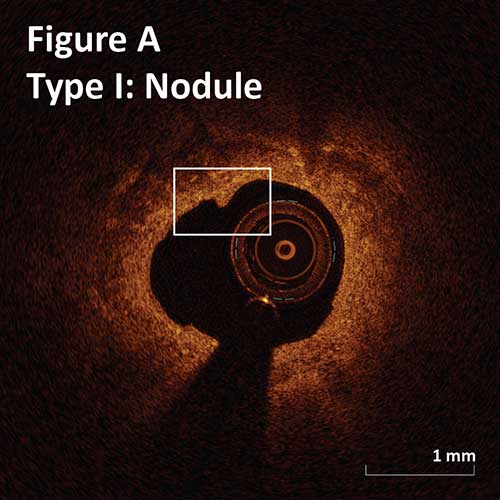
Post Atherectomy
Type I. Superficial intimal flap with smooth luminal border:
Nodule: flaps length <0.5 mm. (Figure A)
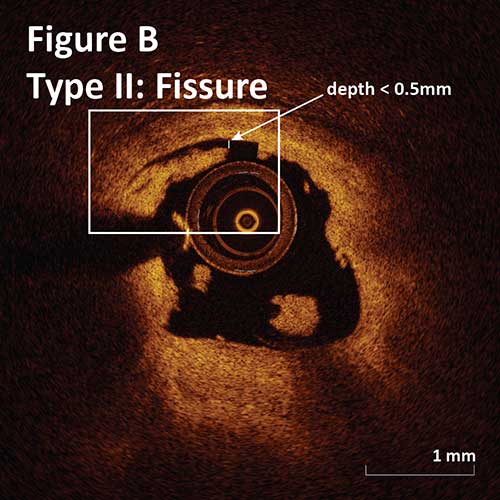
Type II. Deep intimal cut with irregular luminal border:
Fissure: 0–0.5 mm depth and 1 mm length. (Figure B)
Gutter: 0.5–1 mm depth and >1 mm length.
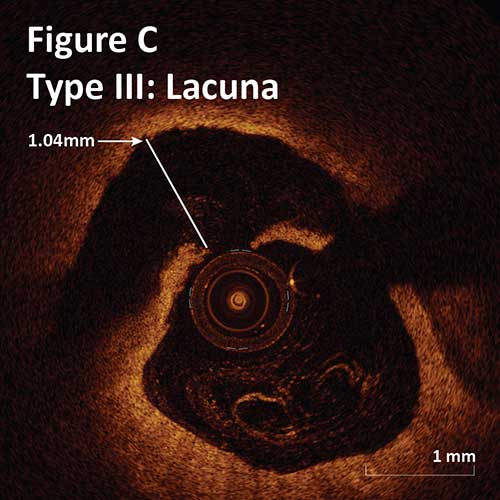
Type III. Deeper intimal-medial dissection with non-cylindrical lumen:
Crater: >1 mm depth and >3 mm length.
Lacuna: <1 mm depth and <3 mm length. (Figure C)
–There is no significant difference between the rate of each tissue modification seen with OA and RA. Craters and Lacunae occur in a third of lesions of OA and RA.1
–There is a difference between OA and RA regarding the severity of each tissue modification. Post OA lacunae were significantly deeper and have a bulging appearance.1
–Post OA modification of calcified plaque resulted in better stent apposition and expansion.1
–Overall, OA results in more severe tissue modification as compared to RA which may explain better stent placement but at the same time has higher risk of deep dissections, which may lead to perforation.1
1Catheter Cardiovasc Interv, 2015 Nov 15;86(6):1024-32.
Management of Stent Edge Dissection
A major edge dissection is defined as a dissection ≥60 degrees of the circumference and/or ≥3 mm in length. An additional stent implantation may be considered for a major edge dissection, especially if it is associated with an intra-dissection lumen <90% of the respective proximal or distal reference area.1 Stent edge dissections may be covered with an additional stent as illustrated in Figure I or observed without further intervention as seen in Figure II.
1Lancet 2016; 388:2618-28.
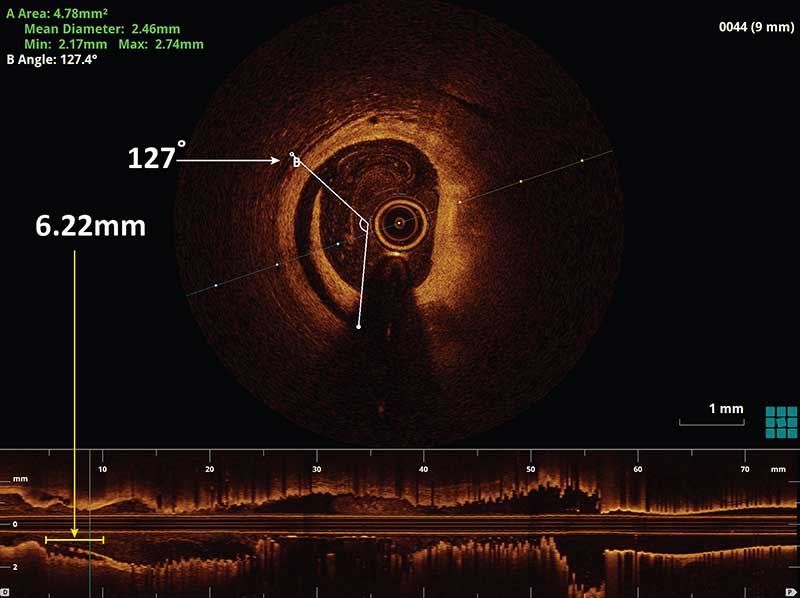
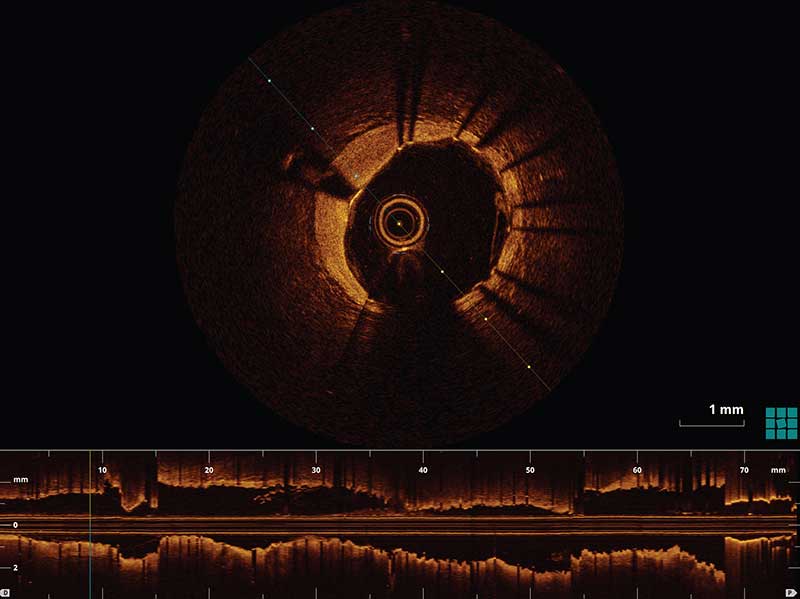
Figure I. An example of a stent edge dissection (white arrow) measuring to be 127 degrees of the lumen circumference in the cross sectional OCT image and 6.2 mm in length (yellow arrow) as measured in the longitudinal OCT L-mode. The following image demonstrates the same patient post stenting over the stent edge dissection. There is no longer a dissection flap present in the cross sectional OCT image.
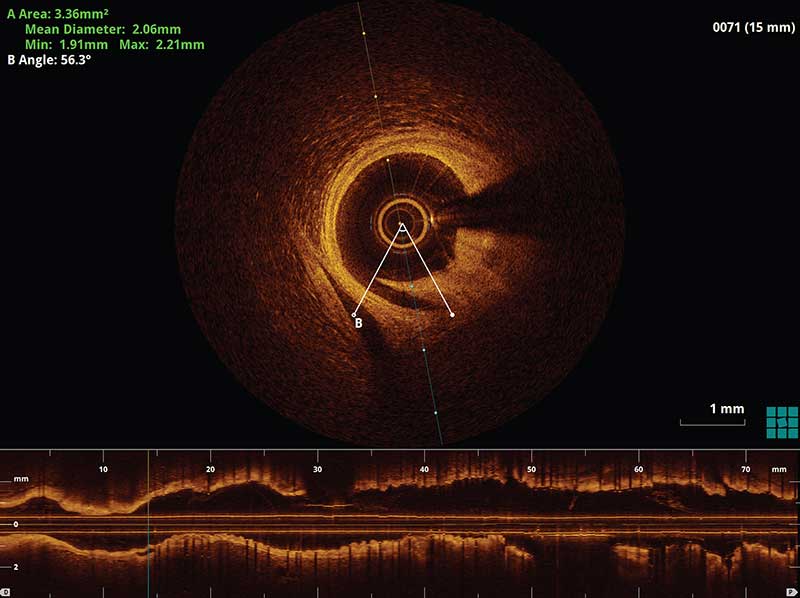
Figure II. An example of a small distal stent edge dissection which was less than 60 degrees of the lumen circumference and less than 3 mm. A decision was made that no further intervention was required for this case.
Management of Stent Malapposition
It is recommended that if stent malapposition is detected, further stent expansion should be considered during the intervention if there is stent under-expansion. Stent under-expansion is defined as an MSA of the proximal segment <90% of the proximal reference lumen area or an MSA of the distal segment <90% of the distal reference lumen area.1
1Lancet 2016; 388:2618-28.
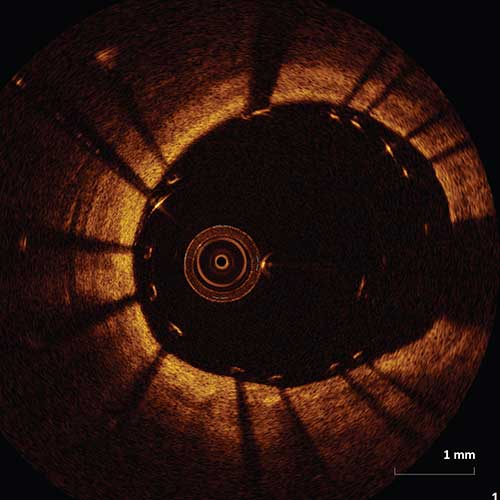
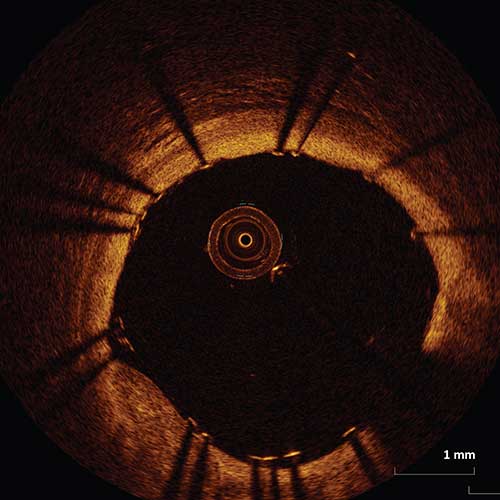
Figure I. An example of a malapposed stent which met criteria for stent under-expansion. A decision was made to further expand the stent with multiple balloon inflations. The following image demonstrates the same vessel with significantly improved apposition of the stent struts.
Management of Tissue Prolapse
1JACC Cardiovascular Interventions. Instrastent tissue prolapse and late cardiac events: innocent bystander or culprit? 2016 July; Vol 9, issue 14.
